THE GRIDWIND CONSOLE
The whole fleet, one pane of glass.
Clusters, endpoints, and consumption across four regions — the same console our own engineers run the fleet with.
CONSOLE PREVIEW · SIGN IN TO EXPLORE →
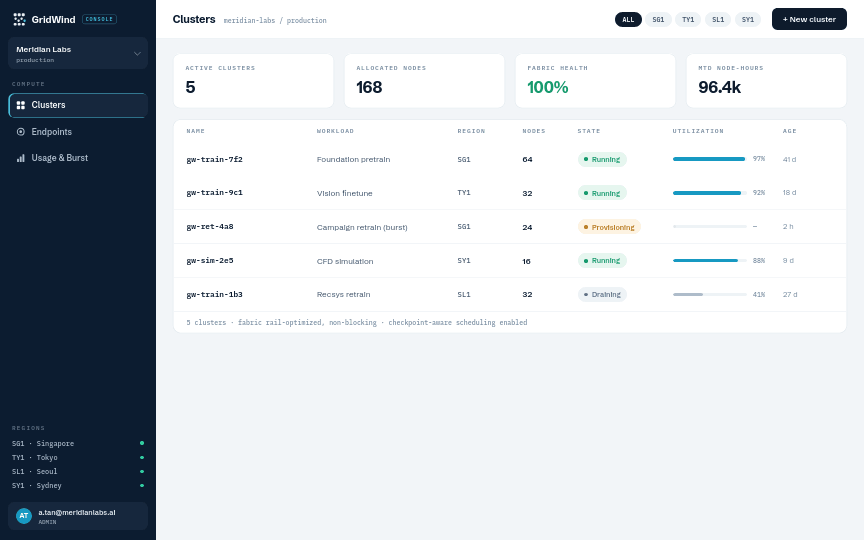
CLUSTERS
Run training like a fleet operator.
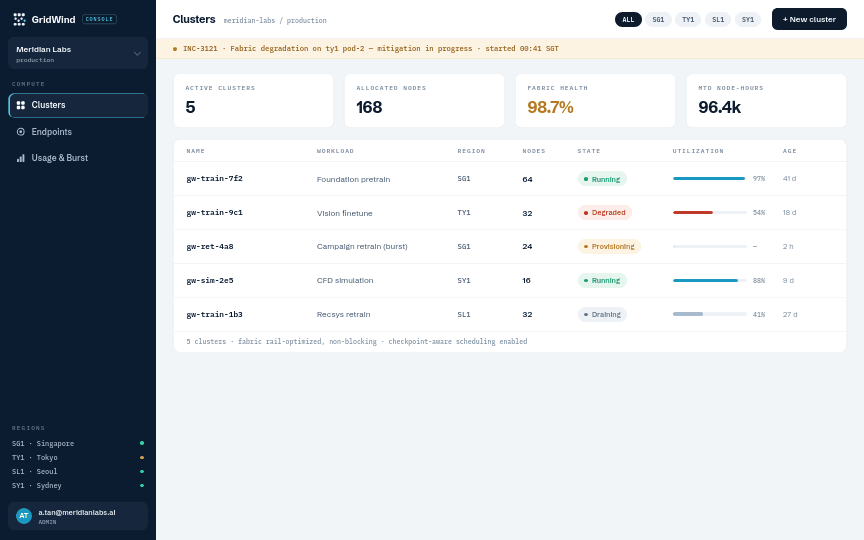
Every cluster, its fabric health, and its utilization — on one screen, current to the minute.
Checkpoint-aware states: Provisioning → Running → Draining
Fabric health surfaced before it hits your loss curve
Drain and hand capacity back in one action
ENDPOINTS
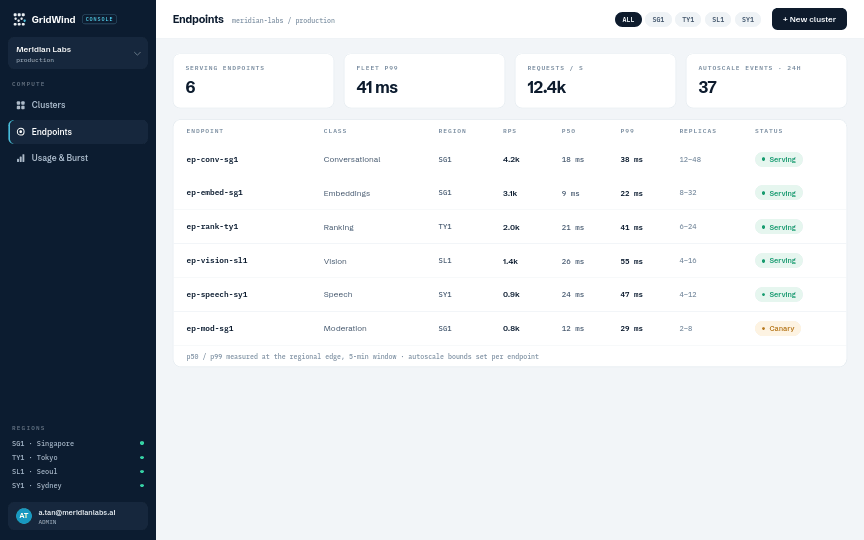
Hold the latency budget.
Per-endpoint p50 and p99, measured at the regional edge — not averaged into meaninglessness.
Autoscale bounds you set, events you can audit
Pin serving to the region your users are in
Canary a new revision on a slice of traffic
USAGE & BURST
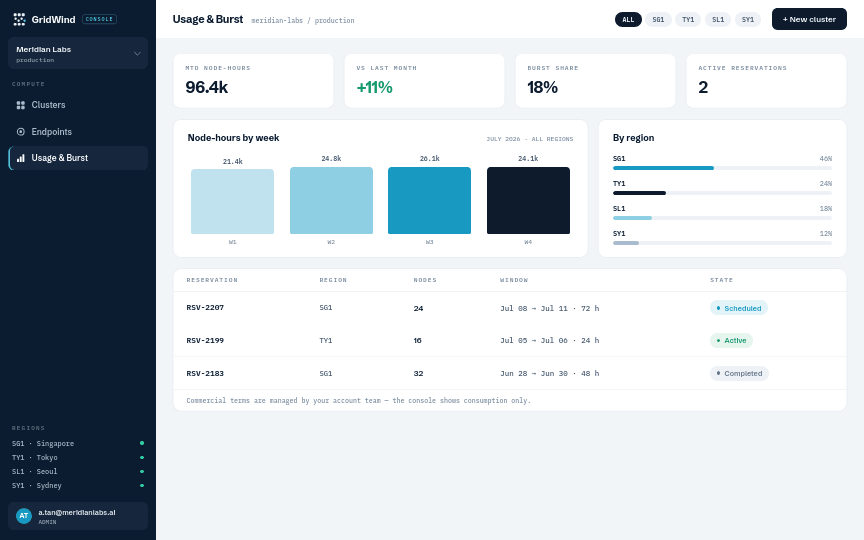
Capacity math, minus the spreadsheet.
Node-hours by week and by region, with burst windows reserved ahead of your campaign drops.
Consumption, current to the hour
Burst reservations booked in advance, visible to the team
No card forms in console — commercials stay with your account team
See it with your own workloads.
A 30-minute walkthrough with a GridWind engineer — your use case, our console, no slideware.
GridWind
GridWind Integrated Solutions Pte. Ltd.
Level 24, CapitaGreen, 138 Market Street
Singapore, 048946
hello@gridwind-solutions.com
Level 24, CapitaGreen, 138 Market Street
Singapore, 048946
hello@gridwind-solutions.com
© 2026 GridWind Integrated Solutions Pte. Ltd. · gridwind-solutions.com
status.gridwind-solutions.com · docs.gridwind-solutions.com